

Sweater sizing
Sweater designs are sized using a combination of available standards: CYC Standards, ASTM Standards and Ysolda's Sizing Chart are all favorites of mine. In all sweater designs, I provide a Finished Chest measurement which is an actual measurement of the finished garment. This means that if you want to have a roomy sweater, you will want to knit a size that is several inches larger than your actual bust size (positive ease) and if you want a fitted sweater, you will want one closer to your actual bust size (no ease or negative ease). Most sweaters also include notation on how much ease is shown by the model. If the pattern states that the model is wearing a sweater with 2" of positive ease, that means that the sweater is 2" larger than her actual bust measurement. So, in order to get the same look, you should add 2" to your chest measurement and knit the size that is closest to that. Schematics are also provided in all garment patterns and you can check other measurements to see how they work for your body. There is much more that goes into garment sizing, but that is the general overview of how to pick a size in one of the patterns you will find here.
© Tot Toppers 2011-2021. All rights reserved.
Hat sizing
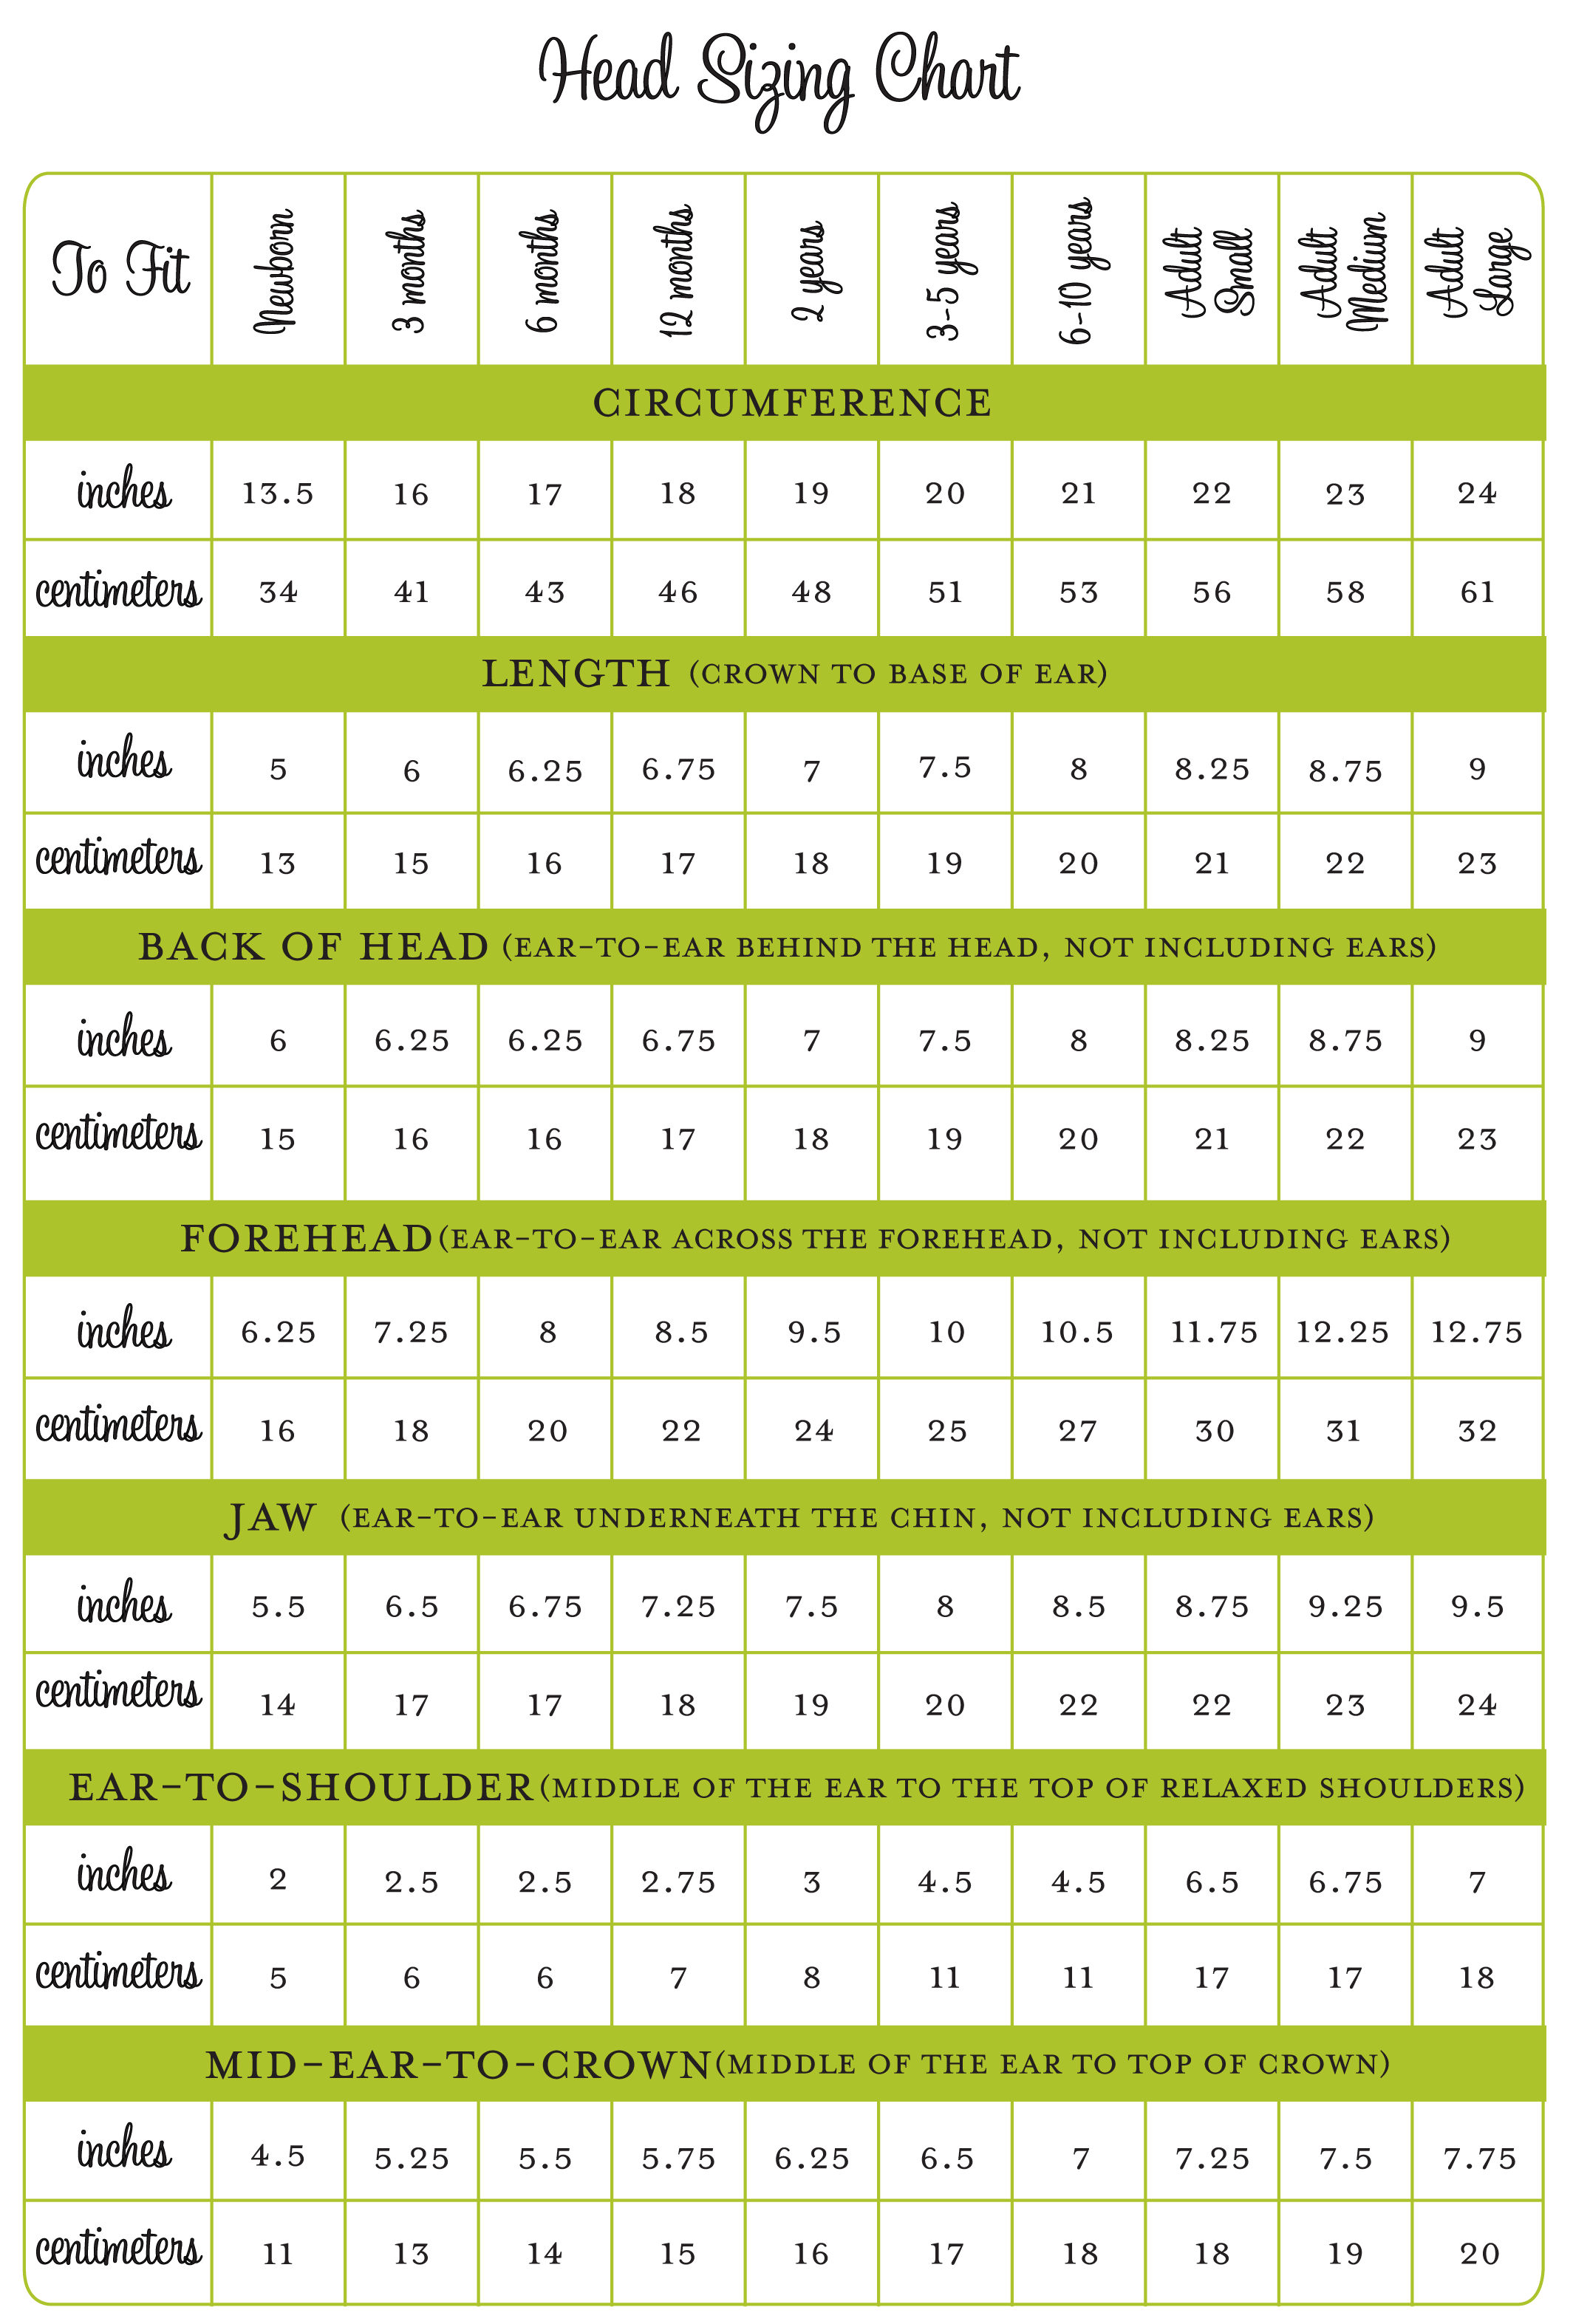
I created the following head sizing chart with originally collected data (2011). There are some great and handy charts already out there for head circumference and ear-to-crown length standards (my personal favorite prior to doing this survey was on Woolly Wormhead's site) but I was interested in getting some additional info that could be used when working on hats with ear flaps, brims, or other interesting features. This chart is the result of that effort. Feel free to use it for your own calculations! This chart also appears in print in Math for Hats, along with a variety of other worksheets and helpful head sizing tools and information. Below the chart you'll find info about how the chart was created, and the data that was used. If you'd like to add your own head stats for future analysis, please click here to fill out the survey. Please note that all children are different and not everyone matches with the averages.
Methodology
This chart wasn't put together by simply averaging a few reported measurements. If you're geeky like me, read on for details on how each value was calculated! Data was collected via internet survey. Respondents were asked to take measurements of themselves and their children or others, and voluntarily provide this information. Survey questions described how measurements were to be taken. Reported data was used to calculate ratios between head circumference and each other measurement. Individual ratios for each age bracket (and measurement) were then averaged. Finally the ratio was used with the head circumference measurements (reported in the World Health Organization's Growth Charts for categories 2 and younger, and the collected data averages for the older categories) in order to create a predicted value for each age category.
A total of 177 respondents participated. 27 participants were 2 years old or younger. 28 were between ages 3-10. 11 were between age 11 and 23. The remaining 111 participants were 24 years or older.